Diagnostics
ABG interpretation: the basic steps
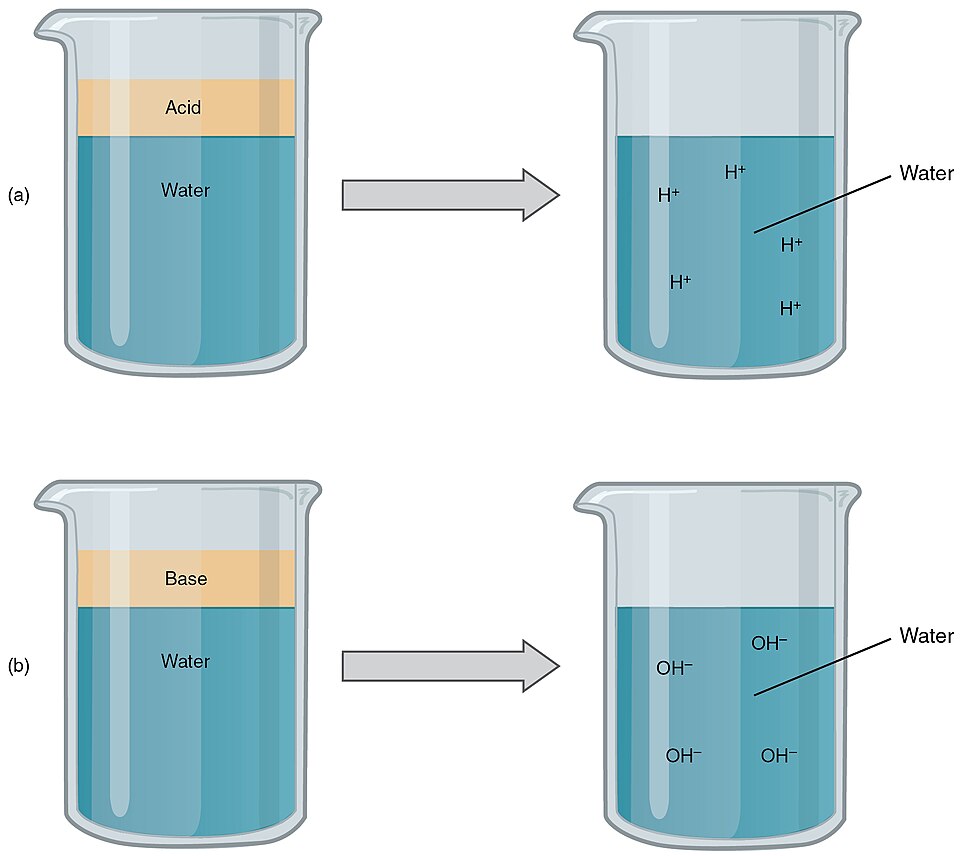
A basic acid–base illustration: more hydrogen ions mean a lower pH. In an ABG, interpret the blood pH together with PaCO2 and bicarbonate to identify the disturbance.
215 Acids and Bases-01 by OpenStax College. CC BY 3.0. View larger.

Read the acid-base values first, then assess oxygenation separately. An apparently normal value can still be inappropriate for the primary disorder.
Normal values
| Value | Normal range |
|---|---|
| pH | 7.35 to 7.45 |
| PaCO2 | 35 to 45 mmHg |
| HCO3 | 22 to 26 mEq/L |
| PaO2 (healthy young adult, room air at sea level) | About 80 to 100 mmHg |
Use the laboratory’s reference intervals. Expected PaO2 changes with age, altitude, and inspired oxygen; interpret oxygenation in that context.
The steps
- pH. Below 7.35 is acidemia; above 7.45 is alkalemia.
- PaCO2 (the respiratory side). Increased PaCO2 has an acidifying effect; decreased PaCO2 has an alkalinizing effect.
- HCO3 (the metabolic side). Decreased bicarbonate has an acidifying effect; increased bicarbonate has an alkalinizing effect. Either component may reflect a primary disorder or a compensatory response.
- Match the primary problem. A respiratory disorder changes pH and PaCO2 in opposite directions: increased CO2 lowers pH. A metabolic disorder changes pH and HCO3 in the same direction: increased bicarbonate raises pH.
- Check expected compensation. The other component may limit the pH change. Compare its measured value with the expected response; the direction alone cannot distinguish compensation from a second primary disorder. A normal-range pH does not prove that the disorder is fully compensated or exclude a mixed disorder.
- Oxygenation. Read the PaO2 and SaO2 separately from the acid-base picture.
Example
pH 7.29, PaCO2 60 mmHg, HCO3 28 mEq/L: the pH shows acidemia, and elevated PaCO2 supports a primary respiratory acidosis. The higher bicarbonate may reflect a compensatory response, but its presence alone does not establish chronicity or exclude an additional metabolic disorder. Check the expected response and the clinical history.
One compensation calculation: metabolic acidosis
For a primary metabolic acidosis, Winter’s formula estimates the expected respiratory response:
Expected PaCO2 = (1.5 × HCO3) + 8, ± 2 mmHg
If HCO3 is 14 mEq/L, expected PaCO2 is 29 ± 2 mmHg, or 27–31 mmHg. A measured PaCO2 of 40 mmHg would be inappropriately high despite falling within the usual reference range: it suggests an additional respiratory acidosis.
This formula applies to metabolic acidosis. Respiratory disorders require different compensation rules, including distinguishing acute from chronic responses.
Sources
- Kacmarek RM, Stoller JK, Heuer AJ. Egan's Fundamentals of Respiratory Care. Elsevier.
- American Thoracic Society. Interpretation of ABGs.
- Davis MD, et al. AARC Clinical Practice Guideline: Blood Gas Analysis and Hemoximetry: 2013.
Last updated October 28, 2026.