Diagnostics
Capnography: end-tidal CO2 and the waveform
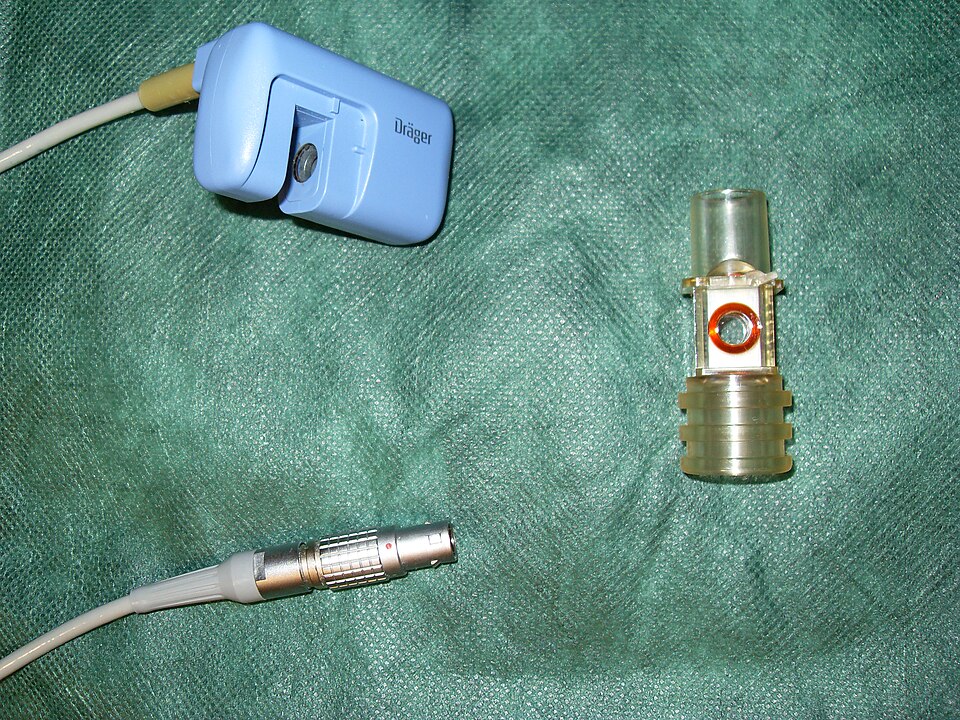
The sensor and airway adapter are parts of the measurement system. The waveform below explains the information a working capnograph adds to the CO2 number.
Capnometry parts apart by Blogotron. CC0 1.0. View larger.

Capnometry reports a CO2 value. Capnography adds a waveform showing CO2 throughout the breath. End-tidal CO2 (ETCO2) is the value at the end of expiration.
A common resting adult reference range is 35–45 mmHg. Interpret it with the waveform and the patient’s condition; it is not a universal ventilation target.
Read a normal time-based capnogram
The horizontal axis is time and the vertical axis is CO2:
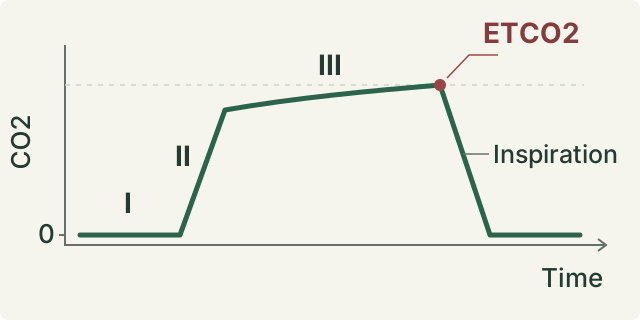
- Early expiration, or phase I: gas from the conducting airways reaches the sensor; CO2 is near zero.
- Expiratory upstroke, or phase II: dead-space gas mixes with alveolar gas, producing a rapid rise.
- Alveolar plateau, or phase III: predominantly alveolar gas is exhaled. The plateau normally slopes slightly upward; ETCO2 is read at its end.
- Inspiratory downstroke: fresh inspired gas brings the trace back toward a near-zero baseline.
The waveform provides information that a number alone cannot show. Look at its presence, respiratory frequency, baseline, shape, and trend.
Recognize changes without assuming a diagnosis
| Finding | Possible explanation |
|---|---|
| Sloping upstroke and plateau, or “shark-fin” appearance | Delayed emptying from bronchospasm or partial airway obstruction. This pattern is not specific to asthma. |
| Abrupt loss of the waveform | Apnea, airway displacement or obstruction, disconnected equipment, a sampling problem, or severely reduced pulmonary blood flow. |
| Falling ETCO2 | A change in ventilation, perfusion, or CO2 production; a low number alone does not prove hyperventilation. |
An abrupt loss of a previously present waveform calls for immediate patient, airway, circuit, and sampling-system assessment. Do not assume that the monitor is the only problem.
ETCO2 is not PaCO2
PaCO2 measures arterial CO2; ETCO2 measures sampled exhaled gas. The difference can widen as physiologic dead space increases, and it can change over time in the same patient.
Capnography depends on CO2 production, its delivery to the lungs by blood flow, and its removal by ventilation. Secretions, condensation, or sampling-line problems can also distort readings. It does not replace an ABG when arterial CO2 and acid-base status are needed.
Worked example
A study case has PaCO2 54 mmHg and simultaneous ETCO2 32 mmHg:
Arterial-to-end-tidal difference = 54 − 32 = 22 mmHg.
The ETCO2 cannot be used as an interchangeable estimate of PaCO2 here. Consider increased dead space, altered perfusion, and sampling quality. The difference alone does not diagnose pulmonary embolism or identify a single cause.
For the arterial measurements, review ABG interpretation.
Sources
- Walsh BK, Crotwell DN, Restrepo RD. AARC Clinical Practice Guideline: Capnography/Capnometry During Mechanical Ventilation: 2011.
- EMS System for Metropolitan Oklahoma City and Tulsa. Protocol 3H: Waveform Capnography — Adult & Pediatric. 2020.
- Los Angeles County EMS Agency. Case of the Month: November/December 2024. Capnography waveform discussion.
Last updated October 28, 2026.